

Detection Target
Determination of additive content in rolling oil for aluminum foil/sheet/strips
Overview
Rolling oil is an extremely important auxiliary material in the production process of aluminum sheets, strips, and foils. It directly affects the operation of the process and the quality of the final product, while the additive content in the rolling oil is a key performance indicator. The additives in rolling oil mainly consist of acids, alcohols, and esters, all of which contain oxygen-containing functional groups (carboxyl, hydroxyl, and ester groups, respectively). Their characteristic absorption peaks do not interfere with each other and remain unaffected by the background (base oil). Based on the Lambert-Beer law, a working curve can be established between component concentration and absorbance, allowing the accurate determination of each additive component's concentration by measuring the absorbance of their respective peaks in the sample spectrum.
Using infrared spectroscopy to measure the additive content in rolling oil enables fast and precise results, while completely avoiding the drawbacks of chemical methods, such as high error rates, cumbersome procedures, and elevated costs (due to excessive reagent consumption).
Principle
By utilizing the characteristic absorption peaks of each component in aluminum foil rolling oil additives at different wavenumbers in the infrared region (e.g., alcohols exhibit a characteristic peak at 1052 cm-1, while acids and esters show peaks at 1709 cm-1 and 1743 cm-1, respectively), a series of standard solutions are prepared by diluting reference materials with base oil (a kerosene-based lubricant with C12-C16 carbon chains) at specific ratios. According to the Lambert-Beer law, the concentration of each solute exhibits a linear relationship with its absorbance as concentration increases. By substituting the absorbance values of the characteristic peaks from the test sample into the linear equations, the concentration of each component in the sample can be determined.
Operating Conditions
1.Instruments and Accessories
1) HKL-FTIR Spectrometer for Additive Content of Rolling oil In Aluminum sheets, strips, and foils
2) Liquid test accessory: Fixed liquid cell (φ=30 mm)
2.Others
1) Dodecanol (C12H26O), purity: 99%
2) Hexadecanol (C16H34O), purity: 98%
3) Methyl palmitate (C17H34O2), purity: >97%
4) Lauric acid (C12H24O2), purity: 97.5% 5)n-Tridecane (C13H28), purity: 99%
3.Test conditions
1) Resolution: 4 cm-1
2) Scan times: 32
3) Detector: Pyroelectric Infrared Detector
4.Measurement of Optical Path Length in Liquid Cells
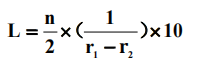
The interferogram method was utilized by placing the empty fixed liquid cell in the optical path and scanning (scanning range: 1900 cm-1 to 600 cm-1) to obtain interference fringes containing maxima and minima. The optical path length of the fixed liquid cell was then calculated using the formula:
Sample Measurement
Carefully inject the sample into the liquid cell using a glass syringe (ensure no air bubbles are present in the cell; if observed, repeat the injection). Position the liquid cell in the optical path and perform the scan using n-Tridecane spectrum as the background.
Using the tangent of each absorption peak as the baseline, measure the absorbance of the maximum absorption peaks at approximately 1743 cm-1, 1709 cm-1, and 1052 cm-1. Substitute the obtained absorbance values into the calibration curve to determine the concentration of each component in the sample.
Establishment of Calibration Curves
1.Preparation of Standard Solutions
Using n-Tridecane as the solvent and various additives as solutes, prepare the following standard solutions by mass percentage. The absorbance values are substituted into the calibration curves to determine the concentration of each component in the samples.
1)Standard Solutions for Aluminum Foil Rolling Oil
Serial | Dodecanol (wt%) | Lauric Acid (wt%) |
1 | 0.5 | 0.05 |
2 | 1.0 | 0.10 |
3 | 1.5 | 0.15 |
4 | 2.0 | 0.20 |
5 | 2.5 | 0.25 |
2) Standard Solutions for Aluminum Sheet/Strip Rolling Oil
Serial | Hexadecanol (wt%) | Methyl Palmitate (wt%) | Lauric Acid (wt%) |
1 | 1.80 | 0.20 | 0.03 |
2 | 3.60 | 0.40 | 0.06 |
3 | 5.40 | 0.60 | 0.09 |
4 | 7.20 | 0.80 | 0.12 |
5 | 9.00 | 1.00 | 0.15 |
2.Measurement of Standard Solutions
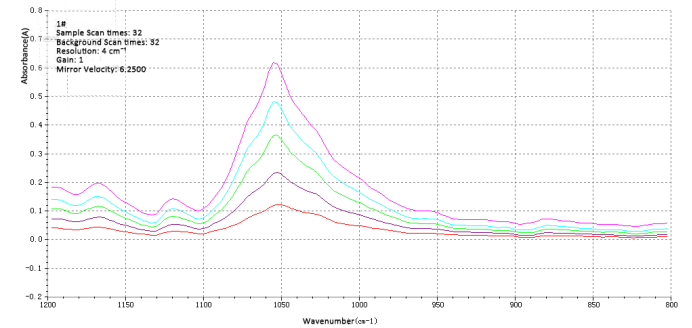
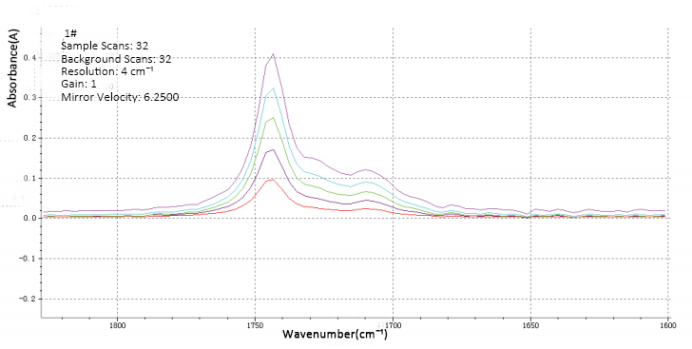
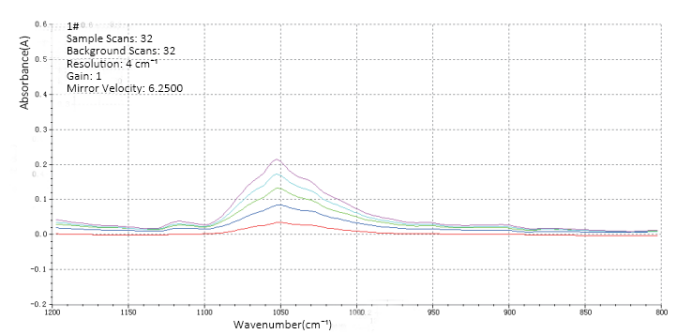
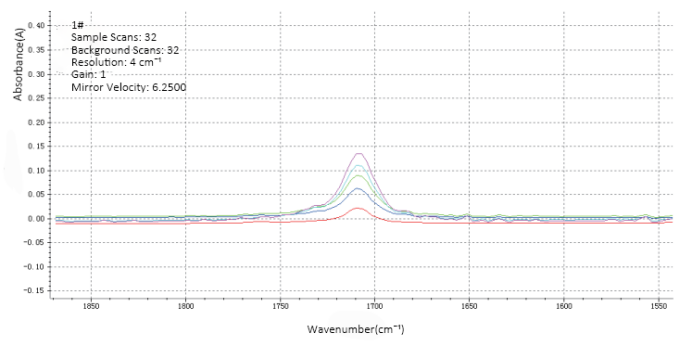
Using n-Tridecane as the background, measure the two sets of standard solutions and record the absorbance values of each absorption peak (example spectra shown below).
2.1 Calibration Curve Spectra for Aluminum Sheet/Strip Rolling Oil
2.1.1 Characteristic Absorption Peak of Hexadecanol
2.1.2 Absorption Peaks of Methyl Palmitate and Lauric Acid
2.2 Calibration Curve Spectra for Aluminum Foil Rolling Oil
2.2.1 Characteristic Absorption Peak of Dodecanol
2.2.2 Characteristic Absorption Peak of Lauric acid
3.Establishment of Calibration Curves
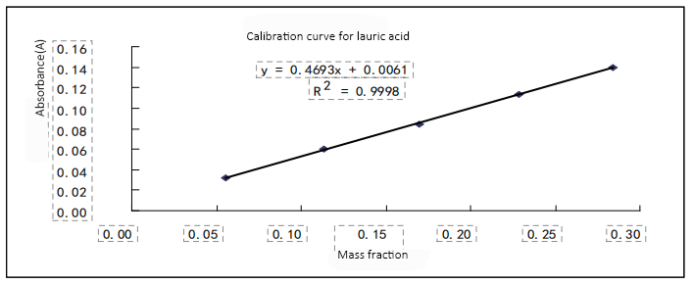
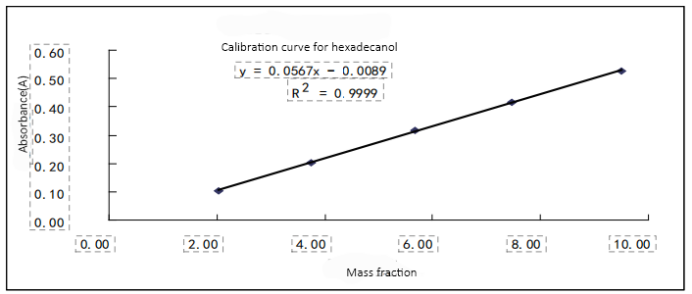
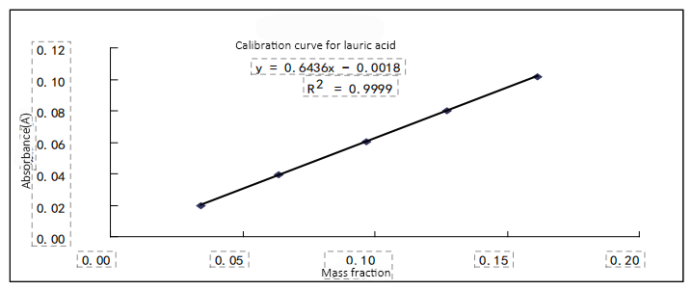
Standard curves were constructed with the mass fraction (%) of standard solutions as the x-axis and absorbance as the y-axis. The calibration curve equations and R² values were then determined (example shown below).
Table 1. Calibration Curve for Dodecanol Content vs. Absorbance | ||
Serial | Dodecanol (wt%) | A1052 cm-1 (Baseline: 1105-835 cm-1) |
1 | 0.54 | 0.03 |
2 | 1.11 | 0.07 |
3 | 1.66 | 0.11 |
4 | 2.24 | 0.15 |
5 | 2.78 | 0.19 |
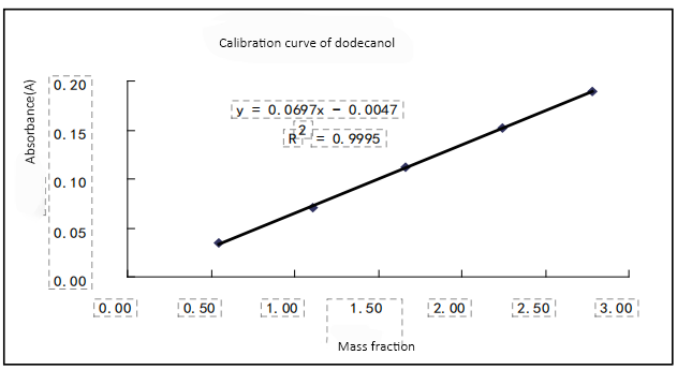
Table 2. Calibration Curve for Lauric Acid Content vs. Absorbance (Aluminum Foil) | ||
Serial | Lauric Acid (wt%) | A1709 cm-1 (Baseline: 1840-1570 cm-1) |
1 | 0.06 | 0.03 |
2 | 0.11 | 0.06 |
3 | 0.17 | 0.08 |
4 | 0.23 | 0.11 |
5 | 0.28 | 0.14 |
| Table 3. Calibration Curve for Hexadecanol Content vs. Absorbance | ||
Serial | Hexadecanol(wt%) | A1052cm-1 (Baseline: 1105-835 cm-1) |
1 | 2.02 | 0.10 |
2 | 3.74 | 0.20 |
3 | 5.68 | 0.32 |
4 | 7.47 | 0.42 |
5 | 9.49 | 0.53 |
| Table 4. Calibration Curve for Methyl Palmitate Content vs. Absorbance | ||
Serial | Methyl Palmitate (wt%) | A1743cm-1 (Baseline: 1840-1570 cm-1) |
1 | 0.22 | 0.09 |
2 | 0.41 | 0.17 |
3 | 0.63 | 0.25 |
4 | 0.83 | 0.32 |
5 | 1.05 | 0.39 |
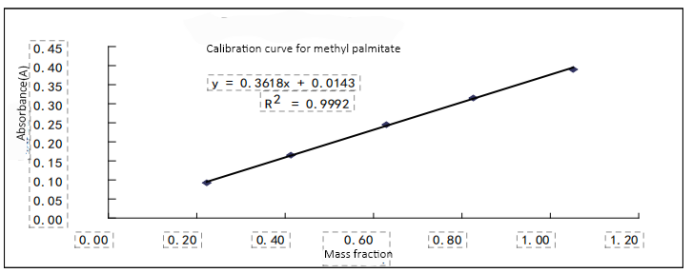
Table 5. Calibration Curve for Lauric Acid Content vs. Absorbance (Aluminum Sheet/Strip) | ||
Serial | Lauric Acid (wt%) | A1709cm-1 (Baseline: 1840-1570 cm-1) |
1 | 0.03 | 0.02 |
2 | 0.06 | 0.04 |
3 | 0.10 | 0.06 |
4 | 0.13 | 0.08 |
5 | 0.16 | 0.10 |
4.Recovery Rate Validation
Serial | True Value (wt%) | Absorbance (A) | Measured Value (wt%) | Recovery Rate (%) | |
1 | 1.78 | 0.12 | 1.77 | 99 | |
2 | Lauric Acid in Aluminum Foil Rolling Oil | 0.18 | 0.09 | 0.19 | 103 |
3 | Hexadecanol | 6.22 | 0.34 | 6.14 | 99 |
4 | Methyl Palmitate | 0.69 | 0.26 | 0.69 | 100 |
5 | Lauric Acid in Aluminum Sheet/Strip | 0.11 | 0.07 | 0.11 | 101 |
Conclusion
The standard curve method for determining additive content in aluminum foil/sheet/strip rolling oils proved accurate, rapid, and operationally simple. With calibration curves exhibiting R2 > 0.999 and recovery rates of 99–103%, the method fully meets quantitative analysis requirements.