

Detection Target
Determination of Alcohol, Ester, Hydroxyl Value, and Saponification Value in Rolling Oils
Overview
Rolling oil serves as a critical auxiliary material in the manufacturing of aluminum sheets, strips, and foils, directly influencing both process performance and end-product quality. The additive content within rolling oil is a key parameter, primarily composed of thermally volatile alcohols and esters—all containing oxygen-functional groups (carboxyl, hydroxyl, and ester groups, respectively). The saponification value of these additives further serves as a vital indicator of lubricating performance.
The characteristic absorption peaks of alcohols, esters, hydroxyl value, and saponification value exhibit no mutual interference and remain unaffected by the base oil matrix. Leveraging the Lambert-Beer law, infrared spectroscopy enables the establishment of calibration curves correlating component concentrations with corrected peak areas. By analyzing the corrected peak areas of absorption bands in sample spectra, the concentrations of additive components can be determined with high accuracy.
The Infrared Spectroscopy method for quantifying alcohols, esters, hydroxyl value, and saponification value in rolling oils achieves rapid and precise results, while entirely circumventing the drawbacks of conventional chemical methods—such as high procedural errors, operational complexity, and elevated costs (due to excessive reagent consumption).
Principle
The method utilizes characteristic infrared absorption peaks of alcohol (FA), ester (FE), hydroxyl value (HV), and saponification value (SV) additives in rolling oils at distinct wavenumbers. Standard solutions are prepared by diluting reference materials with base oil at specified ratios. According to the Lambert-Beer Law, a linear relationship exists between solute concentrations and their corrected peak areas as concentration increases. By substituting the corrected peak areas of characteristic absorption peaks from test samples into these linear equations, the concentrations of each component can be precisely determined.
Application
This method is applicable for the determination of additive content in cold rolling oils, aluminum plates, aluminum strips, aluminum foils, and similar materials.
Operating Conditions
Instruments and Accessories
1) HKL-FTIR Spectrometer for FA,FE,HV,SV content in rolling oil
2) Fixed liquid cell (path length: 0.25mm)
Test Parameters
1) Resolution: 4 cm-1
2) Scan times: 64
3) Detector: Pyroelectric Infrared Detector
4) Scanning range: 4000–400 cm-1
Reagents
1) Petroleum ether (boiling range: 60–90°C)
2) Absolute ethanol (Analytical reagent)
3) Standard sample of rolling oil (known concentration)
Others
1) Analytical balance (0.0001g)
2) Volumetric flask
3) Pipette
4) Micropipette (with tips)
5) Rubber bulb
6) Tweezers
7) Absorbent cotton, etc.
Test Procedures
1. Establishment of Standard Curve
Using a fixed liquid cell accessory, the infrared spectra of five standard solutions with different concentrations were measured by the FTIR spectrometer. The corrected peak areas for alcohol (FA), ester (FE), hydroxyl value (HV), and saponification value (SV) were recorded for each standard (see Table 1). Standard curves for each parameter were established with concentration (content) as the x-axis and corrected peak area as the y-axis.
Table 1. Wavenumber Ranges for Corrected Peak Areas | |
Component | Wavenumber Range (cm-1) |
Alcohol (FA) | 3230–3500 |
Ester (FE) | 1700–1800 |
Hydroxyl Value (HV) | 1040–1070 |
Saponification Value (SV) | 1734–1752 |
2.Sample Testing
The samples were analyzed using the same method as the standard oil samples. The concentrations (contents) of each parameter in the samples were calculated based on the Beer-Lambert Law.
Results and Calculations
1.Standard Curve
The infrared spectra of standard oil samples at different concentrations were overlaid (see Figure 1).
Calibration curves were generated by fitting the infrared spectral response values of each component to their actual concentrations. The linear regression equations and correlation coefficients (R2) are listed in Table 2.
|
Figure 1. The red, purple, green, blue, and pink spectra represent the infrared spectra of standard oil samples with increasing concentrations (from low to high). |
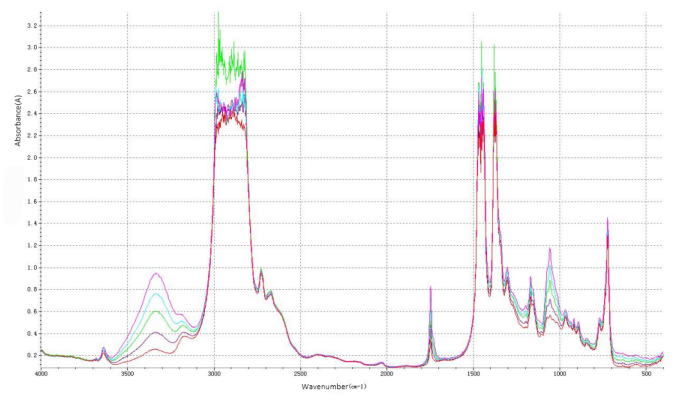
Table 2. Linear Regression Equations and Correlation Coefficients (R2) | ||
Component | Linear Regression Equation | Correlation Coefficient (R²) |
Alcohol (FA) | y=8.4344x−15.277 | 0.9989 |
Ester (FE) | y=8.4807x−0.161 | 0.9973 |
Hydroxyl Value (HV) | y=0.1273x−0.6114 | 0.9985 |
Saponification Value (SV) | y=0.601x+0.2808 | 0.9941 |
2.Sample Calculations
The concentrations of each component in the samples were calculated and are presented in Table 3.
Table 3. Concentration (Content) of Components in Samples | ||||
Sample Name | Alcohol (wt%) | Ester (wt%) | Hydroxyl Value (mg KOH/g) | Saponification Value (g KOH/g) |
Sample 1 | 5.045 | 1.402 | 14.764 | 3.548 |
Sample 2 | 5.068 | 1.089 | 14.426 | 2.737 |
Conclusion
The standard curve method combined with infrared spectroscopy for determining the content of alcohol, ester, hydroxyl value, and saponification value in rolling oils proved to be accurate, rapid, and operationally simple. With calibration curves demonstrating R2 > 0.994 and recovery rates between 99% and 103%, the method fully meets the requirements for quantitative analysis.