

Detection Target
Determination of Trans Fatty Acids in Fats and Oils
Overview
This solution conforms to the AOCS Official Method Cd 14d-99 Rapid Determination of Isolated Trans Geometric Isomers in Fats and Oils by Attenuated Total Reflection Fourier Transform Infrared Spectroscopy. In most naturally occurring vegetable fats and oils, unsaturated constituents contain only isolated, i.e., non-conjugated, double bonds in the cis configuration. These cis bonds may be isomerized to the trans configuration during extraction and processing procedures, due to oxidation, conversion during heating, and/or partial hydrogenation. Animal and marine fats may contain measurable amounts of naturally occurring trans isomers. Isolated trans bonds in long-chain fatty acids, fatty acid methyl esters (FAME), soaps, and triacylglycerols (TAG) may be measured by infrared spectroscopy. An absorption band with a maximum of about 966 cm-1 (10.3 μm), arising from a C-H deformation about a trans double bond, is exhibited in the spectra of all compounds containing an isolated trans group.
Principle
The fat sample, or the fat extracted from the sample using petroleum ether, is directly measured using a Fourier transform infrared (FTIR) spectrometer equipped with a infrared detector and a horizontal attenuated total reflectance (HATR) accessory. The percentage content of trans fatty acids in the total fat is calculated based on calibration with a trans fatty acid standard curve.
Operating Conditions
Instruments and Accessories
1)Instrument: HKL-14 FTIR Spectrometer for Trans Fatty Acids content
2)Accessories: HATR (Horizontal Attenuated Total Reflectance) accessory
Test Parameters
1)Resolution: 4 cm-1
2)Scan times: 64 3)Spectral range: 4000–600 cm-1
Reagents (Unless otherwise specified, all reagents should be of analytical reagent)
1)Petroleum ether (boiling range: 30–60°C)
2)Anhydrous sodium sulfate
3)Triolein standard (purity ≥99%)
4)Trielaidin standard (purity ≥98%)
5)Absolute ethano
Others
1)Analytical balance (0.0001 g precision)
2)Thermostatic waterbath (100 ± 0.1°C)
3)Drying oven (400 ± 0.1°C)
4)Weighing pape
5)Screw-cap vials (brown, 5 ml)
6)Tweezers
7)Defatted cotton
8)Capillary tubes
Sample Preparation
Oil/Fat Samples
1)Clear oil samples can be analyzed directly.
2)Turbid or flocculent oil samples indicate the presence of moisture or impurities. In such cases, add an appropriate amount of anhydrous sodium sulfate, stir thoroughly, and centrifuge to obtain clear fat for analysis.
Non-Oil/Fat Samples
1)Direct fat-extractable samples
Weigh a suitable amount of homogenized sample (ensuring 1–2 g of extracted fat), soak and stir with petroleum ether, filter through filter paper into a flask, and evaporate the extract to dryness using a rotary evaporator at 30°C to obtain fat.
2)Indirect fat-extractable samples (e.g., dairy products)
For non-fat samples containing non-extractable lipids, corresponding methods must be utilized based on food categories to obtain fat content. For example: the Soxhlet extraction method is used for determining free fat; the acid hydrolysis method is applied for determining fat in foods; the alkaline hydrolysis method is adopted for determining fat in milk, dairy products, and specially formulated foods; while the Gerber method is utilized for determining fat in raw milk, sterilized milk, and pasteurized milk.
Standard Solutions
Accurately weigh X g of trielaidin and (0.3 - X) g of triolein (with a precision of 0.0001 g) into a 5 ml brown screw-cap vial, where X corresponds to the following values: 0.0150 g, 0.0300 g, 0.0600 g, 0.0900 g, 0.1200 g, 0.1500 g, and 0.1800 g.
The resulting mixed standard solutions will have trans-fatty acid mass fractions of: 5.00%, 10.00%, 20.00%, 30.00%, 40.00%, 50.00%, and 60.00%, respectively.
Storage: Freeze the standards; they remain valid for 6 months.
Test Procedures
Sample Testing
Place the oil sample or the fat extracted from non-oil samples in a 60°C water bath to melt and maintain the temperature. Immediately draw a small amount of the sample and directly apply it to the zinc sulfide (ZnSe) crystal, ensuring the entire crystal surface is covered. Then, promptly collect its infrared absorption spectrum. The percentage of trans fatty acids in the fat is determined by correcting with a standard curve.
Standard Curve
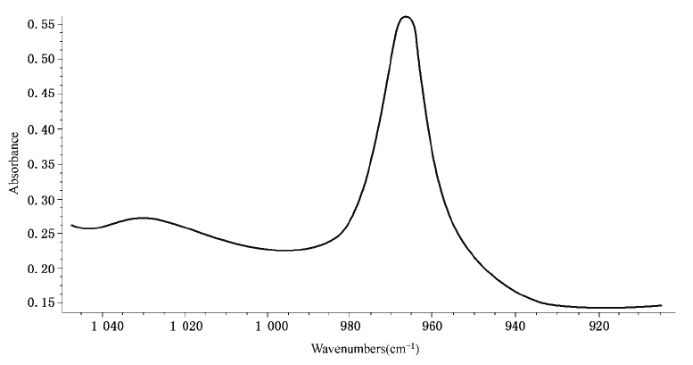
Preparation Perform the same steps as the sample testing procedure for the standard solutions. Using the percentage content (%) of trielaidin in the standard solutions as the X-axis and the peak area of the trans fatty acid characteristic peak at 966 cm⁻¹ in the infrared spectrum (refer to Figure 1, the standard infrared spectrum of trielaidin) as the Y-axis, establish a univariate linear regression equation.
|
Figure 1 Standard Infrared Spectrum of Trielaidin |
Calculation
The mass fraction of trans fatty acids (X) in the sample is calculated using Equation: X= c × k
Where:
X —Mass fraction of trans fatty acids in the sample, %
c —Mass fraction of trans fatty acids in fat obtained from the standard curve, %
k —Mass fraction of fat in the sample (if the sample is pure oil/fat, then k=1).
Test Results
Preparation of the Standard Curve
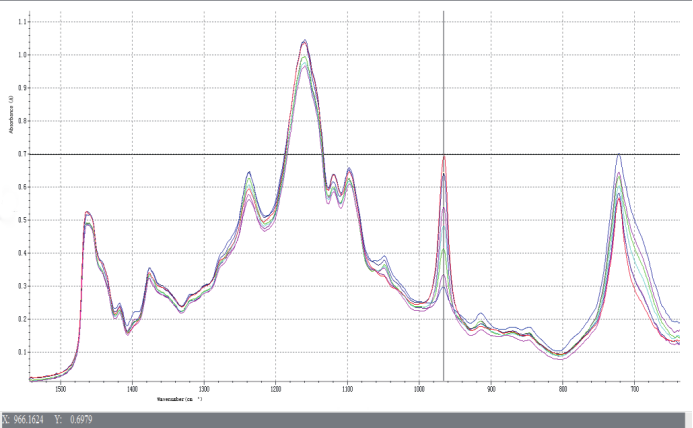
The standard curve for trans fatty acids was established, and infrared standard spectra were obtained for trans fatty acid concentrations of 5.00%, 10.00%, 20.00%, 30.00%, 40.00%, 50.00%, and 60.00%, as shown in the figure below. Each concentration was scanned three times, and the arithmetic mean of the three measurements was taken as the final result.
|
Figure 2 Infrared Spectra of Trans Fatty Acid Standard Samples |
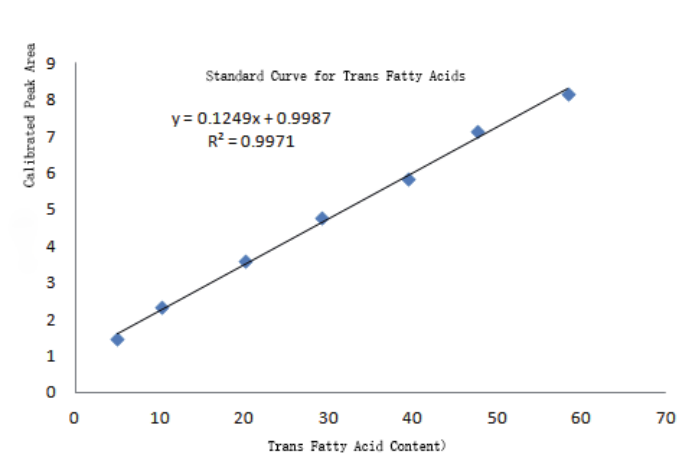 |
Figure 3 HATR test Trans Fatty Acids Standard Curve |
Sample Testing
Known Trans Fatty Acid Content (m, %) | y | Calculated Trans Fatty Acid Content (x, %) |
21.08 | 3.813 | 22.56% |
29.39 | 4.711 | 29.75% |
48.80 | 7.084 | 48.77% |
Notes:(1)Linear equation: y=0.1249x +0.9987. (2)Relative error calculation: δ=(x-m)/m ×100%
Conclusion
The results demonstrate that this method is simple to operate and exhibits excellent linearity. By subjecting trans fats of known concentrations to minimal pretreatment and analyzing their infrared spectra, the trans fatty acid content was calculated using the established standard calibration curve. The results confirm that this method is not only straightforward to perform but also yields accurate measurements, making it well-suited for determining trans fatty acid content in edible oils and fats.