

Detection Target
Determination of T501 Oxidation inhibitor Content in Transformer Oil and Turbine Oil
Overview
This solution conforms to the ASTM D2668 Standard Test Method for 2,6-di-tert-Butyl- p-Cresol and 2,6-di-tert-Butyl Phenol in Electrical Insulating Oil by Infrared Absorption and GB/T 7602.3 Determination of T501 oxidation inhibitor content in transformer oil or turbine oil—Part 3: Infrared spectroscopy method. The HKL-2668 Infrared Spectrometer is designed for determining the content of the T501 (2,6-di-tert-butyl-p-cresol) oxidation inhibitor in transformer oil and turbine oil. It operates based on the principle that the addition of T501 produces an absorption peak at 3,650 cm-1 (2.74 μm), attributed to the O–H stretching vibration. The absorbance of this peak is directly proportional to the concentration of T501, allowing quantification through a calibration curve to determine the mass percentage of T501 in the oil sample.
Principle
In transformer oil and turbine oil, the addition of antioxidant T501 results in the appearance of a phenolic hydroxyl stretching vibration absorption peak at 3650 cm-1 (2.74 μm) in the infrared spectrum. The absorbance of this peak is directly proportional to the concentration of T501. By constructing a standard calibration curve, the mass percentage content of T501 antioxidant in the oil sample can be determined.
Operating Conditions
Instruments and Accessories
1) HKL-2668 Infrared Spectrometer for Anti-Oxidant Additives
2) Fixed liquid cell
Test Parameters
1) Resolution: 4 cm-1
2) Scan times: 64
3) Scan range: 4000–400 cm-1
Reagent (Unless otherwise specified, all reagents should be of analytical reagent)
1) Tetrachloroethylene (C2Cl4)
2) Base transformer oil (provided by the client or prepared in-house; preparation method refers to ASTM D2668)
3) T501 antioxidant
Others
1) Analytical balance (accuracy: 0.0001 g)
2) Rubber bulb pipette filler
3) Micropipette (20–200 μl)
Testing Procedures
Preparation of Standard Oils
Weigh 0.5 g of T501 antioxidant (accurately measured to 0.0001 g) and dissolve it in 99.5 g of base oil under heating (≤70°C) to prepare a standard oil containing 0.50% T501. Store this oil in an amber bottle away from light; it remains stable for three months. Subsequently, weigh 2.0 g, 4.0 g, 8.0 g, 12.0 g, and 16.0 g of this standard oil and dissolve them in 16.0 g, 12.0 g, 8.0 g, 4.0 g, and 2.0 g of base oil, respectively, to obtain standard oils with T501 concentrations of 0.05%, 0.10%, 0.20%, 0.30%, and 0.40%.
Construction of the Calibration Curve
(1) Using a micropipette (20–200 μl), draw the 0.50% T501 standard oil and slowly fill the liquid absorption cell
(2) Place the filled cell in the sample holder of the FTIR spectrometer and record the infrared spectrum in the range of 3800–3500 cm-1. Repeat the scan three times. If the difference between the highest and lowest absorbance (A) values exceeds 0.010, repeat the measurement; otherwise, use the arithmetic mean of the three results as the final value.
(3) Follow the same procedure to measure the infrared spectra of standard oils containing 0.05%, 0.10%, 0.20%, 0.30%, and 0.40% T501. (4)Record the maximum absorbance (A) at 3650 cm-1 (accurate to 0.001).
Measurement of Oil Samples
(1) Using the same micropipette, draw the test oil sample and slowly inject it into the same liquid absorption cell used for the calibration curve.
(2) Under identical instrument conditions as the calibration curve, measure the sample’s absorbance and calculate its value.
(3) Determine the weight percentage content of T501 in the sample by referencing the obtained A value against the calibration curve.
Test Result
1. Preparation of Standard Curve
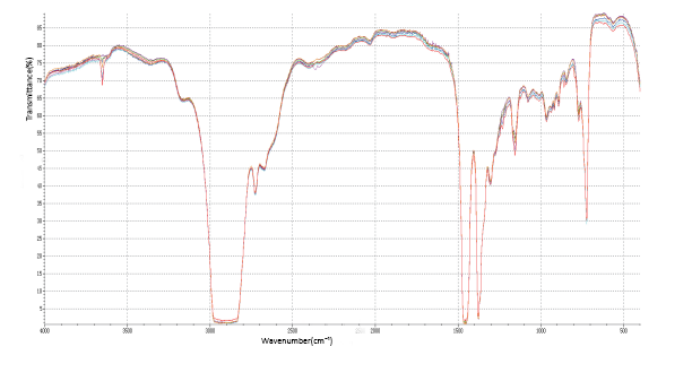
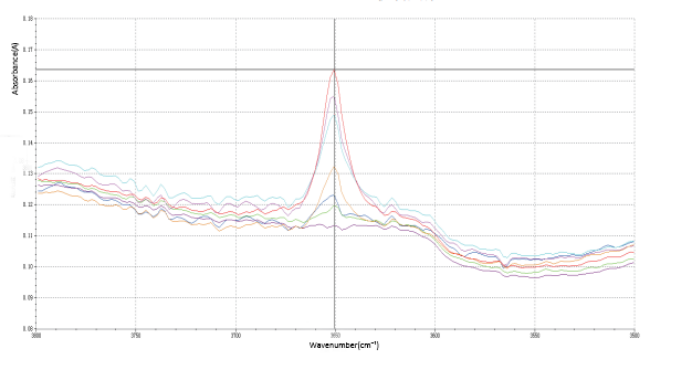
The calibration curve for the antioxidant was established according to standard methods. Infrared spectra were obtained for base oil samples containing T501 antioxidant at concentrations of 0%, 0.05%, 0.10%, 0.20%, 0.30%, 0.40%, and 0.50%. The spectral data in the 3800 cm-1 to 3500 cm-1 range were recorded as shown in the figure below. Each sample was scanned three times, and the arithmetic mean of the three measurements was used as the final result.
|
Figure 1 The purple, green, dark blue, yellow, light blue, pink-purple, and red spectra correspond to base oil containing 0%, 0.05%, 0.10%, 0.20%, 0.30%, 0.40%, and 0.50% T501 antioxidant, respectively. |
|
Figure 2 Magnified view of Figure 1 showing the infrared spectra in the 3800-3500 cm⁻¹ range. |
2. Test Result
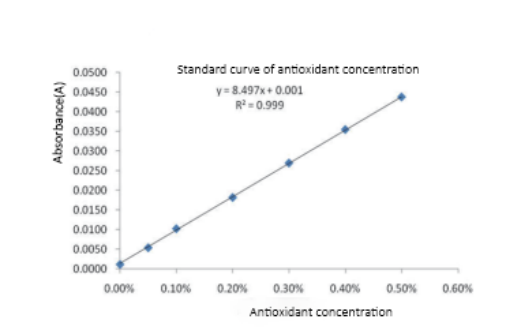 |
Figure 3 Calibration curve for T501 antioxidant content |
3. Calculation
The standard curve for transformer oil antioxidant content is represented by the equation y = 8.497x + 0.001. Based on this, the antioxidant content in the oil sample is calculated to be approximately 0.0883%.
Conclusion
The infrared spectroscopy method proves to be accurate and efficient for determining the T501 antioxidant content in transformer oil. The calibration curve demonstrates excellent linearity with R² = 1, fully meeting the requirements for quantitative analysis.